Let there be graphs
Some years ago I tried to monitor and display some domestic metrics, with my aquariums temperature as a main goal.
I thus bought a profilux monitor, which was expensive. It was also a close system (at least at the time, no API for external access, I quickly gave up trying to hack it), and... mine is now out of order...
So instead of fixing it, I decided to take the Home Assistant road, and, wow, what a trip :)
And guess what, temperature captors are available, easy to use and some of them are waterproof. See me coming?
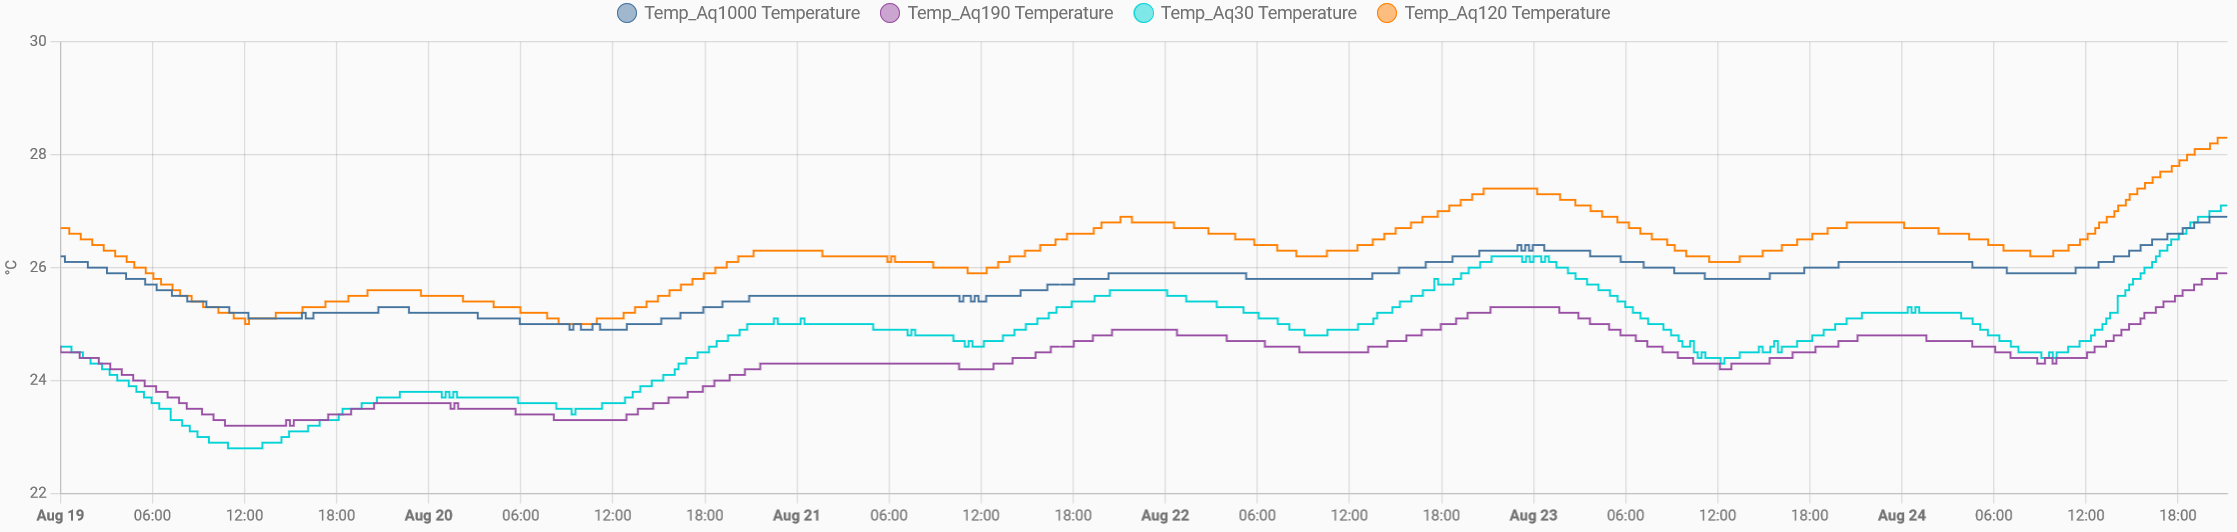
Within a few hours, I had my long awaited water temperatures in a nice graph:
Another proof, if needed, that happiness definitively lies in simple things.
ps: Yes, the Profilux can also monitor pH values, and I've yet to find a Zigbee device that can do that, other than some huge pool stuff.
But unlike my temperatures, my pH is stable, so as long as I have to choose, I'd rather have my sexy temperature curves than ... nothing at all :)
And who knows, maybe tomorrow Amazon will offer me the Zigbee pH sensor I've been waiting for.
Peace out.
By UnexpectedGuest
Fish&Chip(set)
In case of emergency: